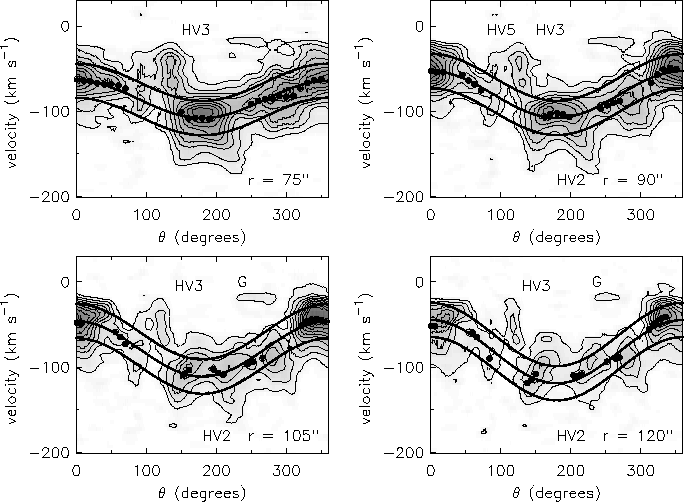
This image is derived from Chapter 7, Figure 8 of my thesis

The blue blob is a three dimensional isosurface in position-position-
velocity space of a dwarf galaxy observed with the Westerbork array.
See it from all directions in the animation below!
If you have software to play an FLC animation, you can download
this file.
In this space, a rotating galaxy repesents a (curved) plane, which
you saw in the animation. In the above picture, the negative (approaching,
or blue shifted) velocity axis is indicated. The right hand side of the galaxy
is the approaching side, the left is the receding side.
The bottom of the cube is the plane of the sky. The velocity of the gas
in a given line of sight (four lines of sight are drawn here) can be
reconstructed, e.g. by taking the intensity weighted mean velocity. This
contraction over velocity results in a map in the plane of the sky, the
velocity field.
In this animation you see the three-dimensional shape of a galaxy
in an HI datacube. This is actual data from the Westerbork Synthesis
Radio Telescope in The Netherlands. The loose blobs on one side of the
galaxy are the result of unrelated emission of Galactic atomic hydrogen in the
foreground.
This second animation shows the same 3 dimensional representation of
the line emaission of atomic hydrogen for a dwarf galaxy which is much
smaller and fainter than the previous one. The first impression is that
of two big blobs which are barely connected. These two blobs represent
two HI complexes in this galaxy. A more extended, faint HI halo is not
visible in this animation. The rotation velocity in this galaxy is
15 km/s, only twice the velocity of the velocity of the turbulent
motions.

The rotation velocity as a function of distance from the centre and
the angle at which we observe the galaxy, can, under certain
conditions, be derived from the velocity field by a tilted ring
analysis. The galaxy is divided into concentric rings (ellipses when
viewed from an angle). From simple geometric arguments, the observed
radial velocity along a ring is expected to vary as the cosine of the
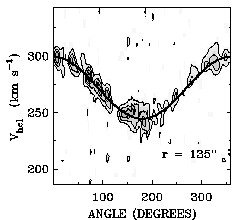
position angle. The figure below gives an example of a position angle
- velocity map for a single annulus in a nearby dwarf which is
considerably fainter than the two shown above. The curved line is the
model velocity for that annulus. HI with an anomalous velocity can be
easily identified in a diagram like this (none in this particular
figure however).

This image is derived from Chapter 7, Figure 8 of my thesis
In my thesis, and in a forthcoming paper, we address questions such as the fraction of the mass contained in the high-velocity HI gas, energetics etc.