| Home |
| Publication list (ADS) |
| Contact |
| Research |
| NGC 1569 |
| UGCA 86 |
| VGPS |
| Dwarf galaxies |
NGC 1569
1. Peculiarities.
NGC 1569 is a nearby (2.2 Mpc) dwarf galaxy, probably a member of the IC 342 group. An intense starburst disrupted the centre of NGC 1569. The star formation rate has declined over the past 10 Myr or so, but it is still very high. Note dust clouds which obscure some parts of the bright starburst region in the image above. Observational evidence for an outflow of gas along the minor axis of NGC 1569 exists from H-alpha images and kinematics, direct observation of the hot gas in X-rays, and atomic hydrogen observations which show large departures of rotational velocities. Two, possibly three, luminous super-starclusters have formed in the starburst. These clusters are believed to resemble very young globular clusters.
The appearance of the galaxy changes drastically when viewed in H-alpha emission. Several autors published H-alpha images. For a recent thorough reference, see Waller, Ap.J. 370,144. H-alpha filaments extend preferentialy southwards parallel to the minor axis even out of the field of the image shown here.
2. Evidence for interaction from new HI data.
Note : this is a summary of a paper (PostScript, PDF) (Stil & Israel 1998, A&A 337,64) (astro-ph/9806267). For a complete discussion with references I refer to this paper.
The distribution of atomic hydrogen in NGC 1569 is dominated by clumpy
ridge with a high column density on the northern side of the
galaxy. On the western side of the galaxy, a slightly curved HI arm is
observed (Reakes MNRAS 192,297; Israel & Van Driel A&A 236,323). In a
paper which was accepted recently by A&A, we report about an HI cloud
with an HI mass of 7 million solar mass and no optical counterpart,
approximately 5 kpc (projected distance) east of NGC 1569. HI line
emission located between this object and NGC 1569 is suggestive of an
HI bridge. The reasons why we associate these features with NGC 1569
and not with the Galactic foreground, are given given in the
paper.
3D contour surface of an Sd type galaxy with a rotation curve which turns over near the
edge of the galaxy (left) and the 60 arcsecond resolution data cube of
NGC 1569 (right). Click on the left image for an explanation of this type of figure.
The large body in the image on the right is NGC 1569. The rotation of NGC 1569 is
visible in the same way as the Sd galaxy on the left, although less clear.
The horizontal "cloudlike" features are atomic hydrogen in our own Galaxy.
NGC 1569-HI and the HI bridge form a long extension from the main body to the lower
left corner. Compare this image with Fig. 3 in our paper.
Remember that the third dimension in this plot is velocity, not a spatial
coordinate!
|
Finally, NGC 1569 is compared with other dwarf galaxies where
HI envelopes with an apparent velocity reversal have been observed.
A galactic outflow
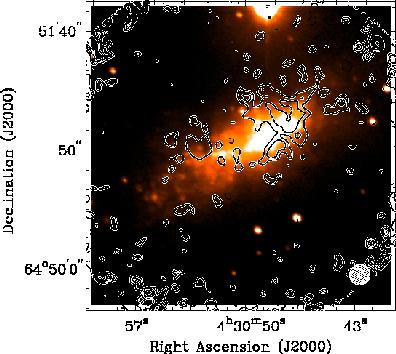
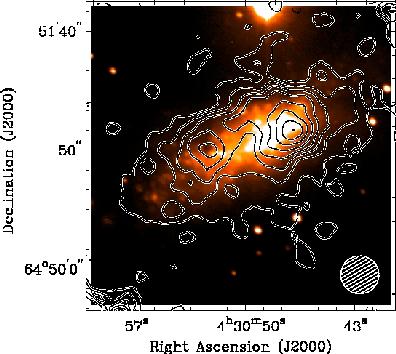
The optical spectrum of NGC 1569 resembles that of a Galactic HII region. As other starburst dwarf galaxies, it is very bright in Halpha, and a number of filaments are seen emerging from the starburst core. The brightest of these filaments is also visible in the radio continuum (see image below). Within the bright starburst core, the radio emission is dominated by thermal emission from the two brightest HII complexes. A halo of non-thermal synchrotron radiation surrounds the galaxy.
 |
High-velocity HI
Not only the outer regions of NGC 1569 display chaotic kinematics. Although there is a general sense of rotation in the main body of NGC 1569, about 10 percent of the HI has velocities that deviate by a large amount from the average rotation velocity. This is best visualized with a position-velocity diagram along an ellipse that corresponds with a single annulus of the disk of NGC 1569. In a quiescent galaxy with ordered rotation one expects the emission to be distributed along a cosine curve in such a diagram (see illustration). The amplitude of the cosine curve depends on the rotation velocity at the selected radius, and on the inclination of the galaxy.
 |
The HI emission in the main body of NGC 1569 displays a similar cosine
structure in a position-velocity diagram along ellipses defined by the
shape of the outer optical isophotes. However, the emission is not so well
defined as in the galaxy shown above. There are two reasons for this: 1.
Some if the HI in NGC 1569 has a velocity that deviates from the rotational
velocity by an amount similar to the rotation velocity; 2. The velocity
dispersion of HI in NGC 1569 is approximately 20 km/s, more than two times
as high as the velocity dispersion of HI commonly observed in galaxies.
The galaxy in the figure above (DDO 47) has an average HI velocity dispersion
of 8.2 km/s (Stil & Israel 2002; A&A 389, 42), which is representative for
dwarf and spiral galaxies.
Position-velocity diagram along ellipses in NGC 1569. The red and blue
cosine curves indicate the line of sight component of the rotation velocity
for radii corresponding with the red and blue ellipses in the panel on the
right. The right panel shows a false-colour representation of the H-alpha
emission, overlaid with a contour map of the HI emission at a velocity of
-48.8 km/s. This velocity is indicated by the horizontal white line in the
left panels. Position angle increases counter-clockwise from the major axis
on the east side of NGC 1569.
Reference: Stil & Israel (2002); A&A 392,473.
Dust in NGC 1569
Interstellar dust within NGC 1569 can be observed as dark patches of extinction, and by its emission at mid-infrared to mm wavelengths. Internal extinction in NGC 1569 is believe to be modest (AV ~ 1 - 2 magnitudes) (Devost et al. 1997, ApJ 482,765, Kobulnicky & Skillman 1997,Hunter et al. 2000). However, locally the extinction can be much larger.Dust in emission was mapped by Lisenfeld, Israel, Stil & Sievers (2002) with the JCMT (SCUBA 450 and 850 micron) and the IRAM 30m telescope (1200 micron). In this paper, the mid_IR to mm spectrum of the dust was fitted with a dust model including large grains and an enhanced amount of very small grains.
|
 |